


How to Profile Osquery Performance With Kolide
“Kyle’s computer is too hot to touch”
Recently, one of Kolide’s own employees reported sporadic degraded performance on his machine throughout the day. Kyle is known to complain (like if his water doesn’t have enough ice, or his bacon is slightly overcooked), but sometimes he complains for good reason, so we decided to investigate the problem.
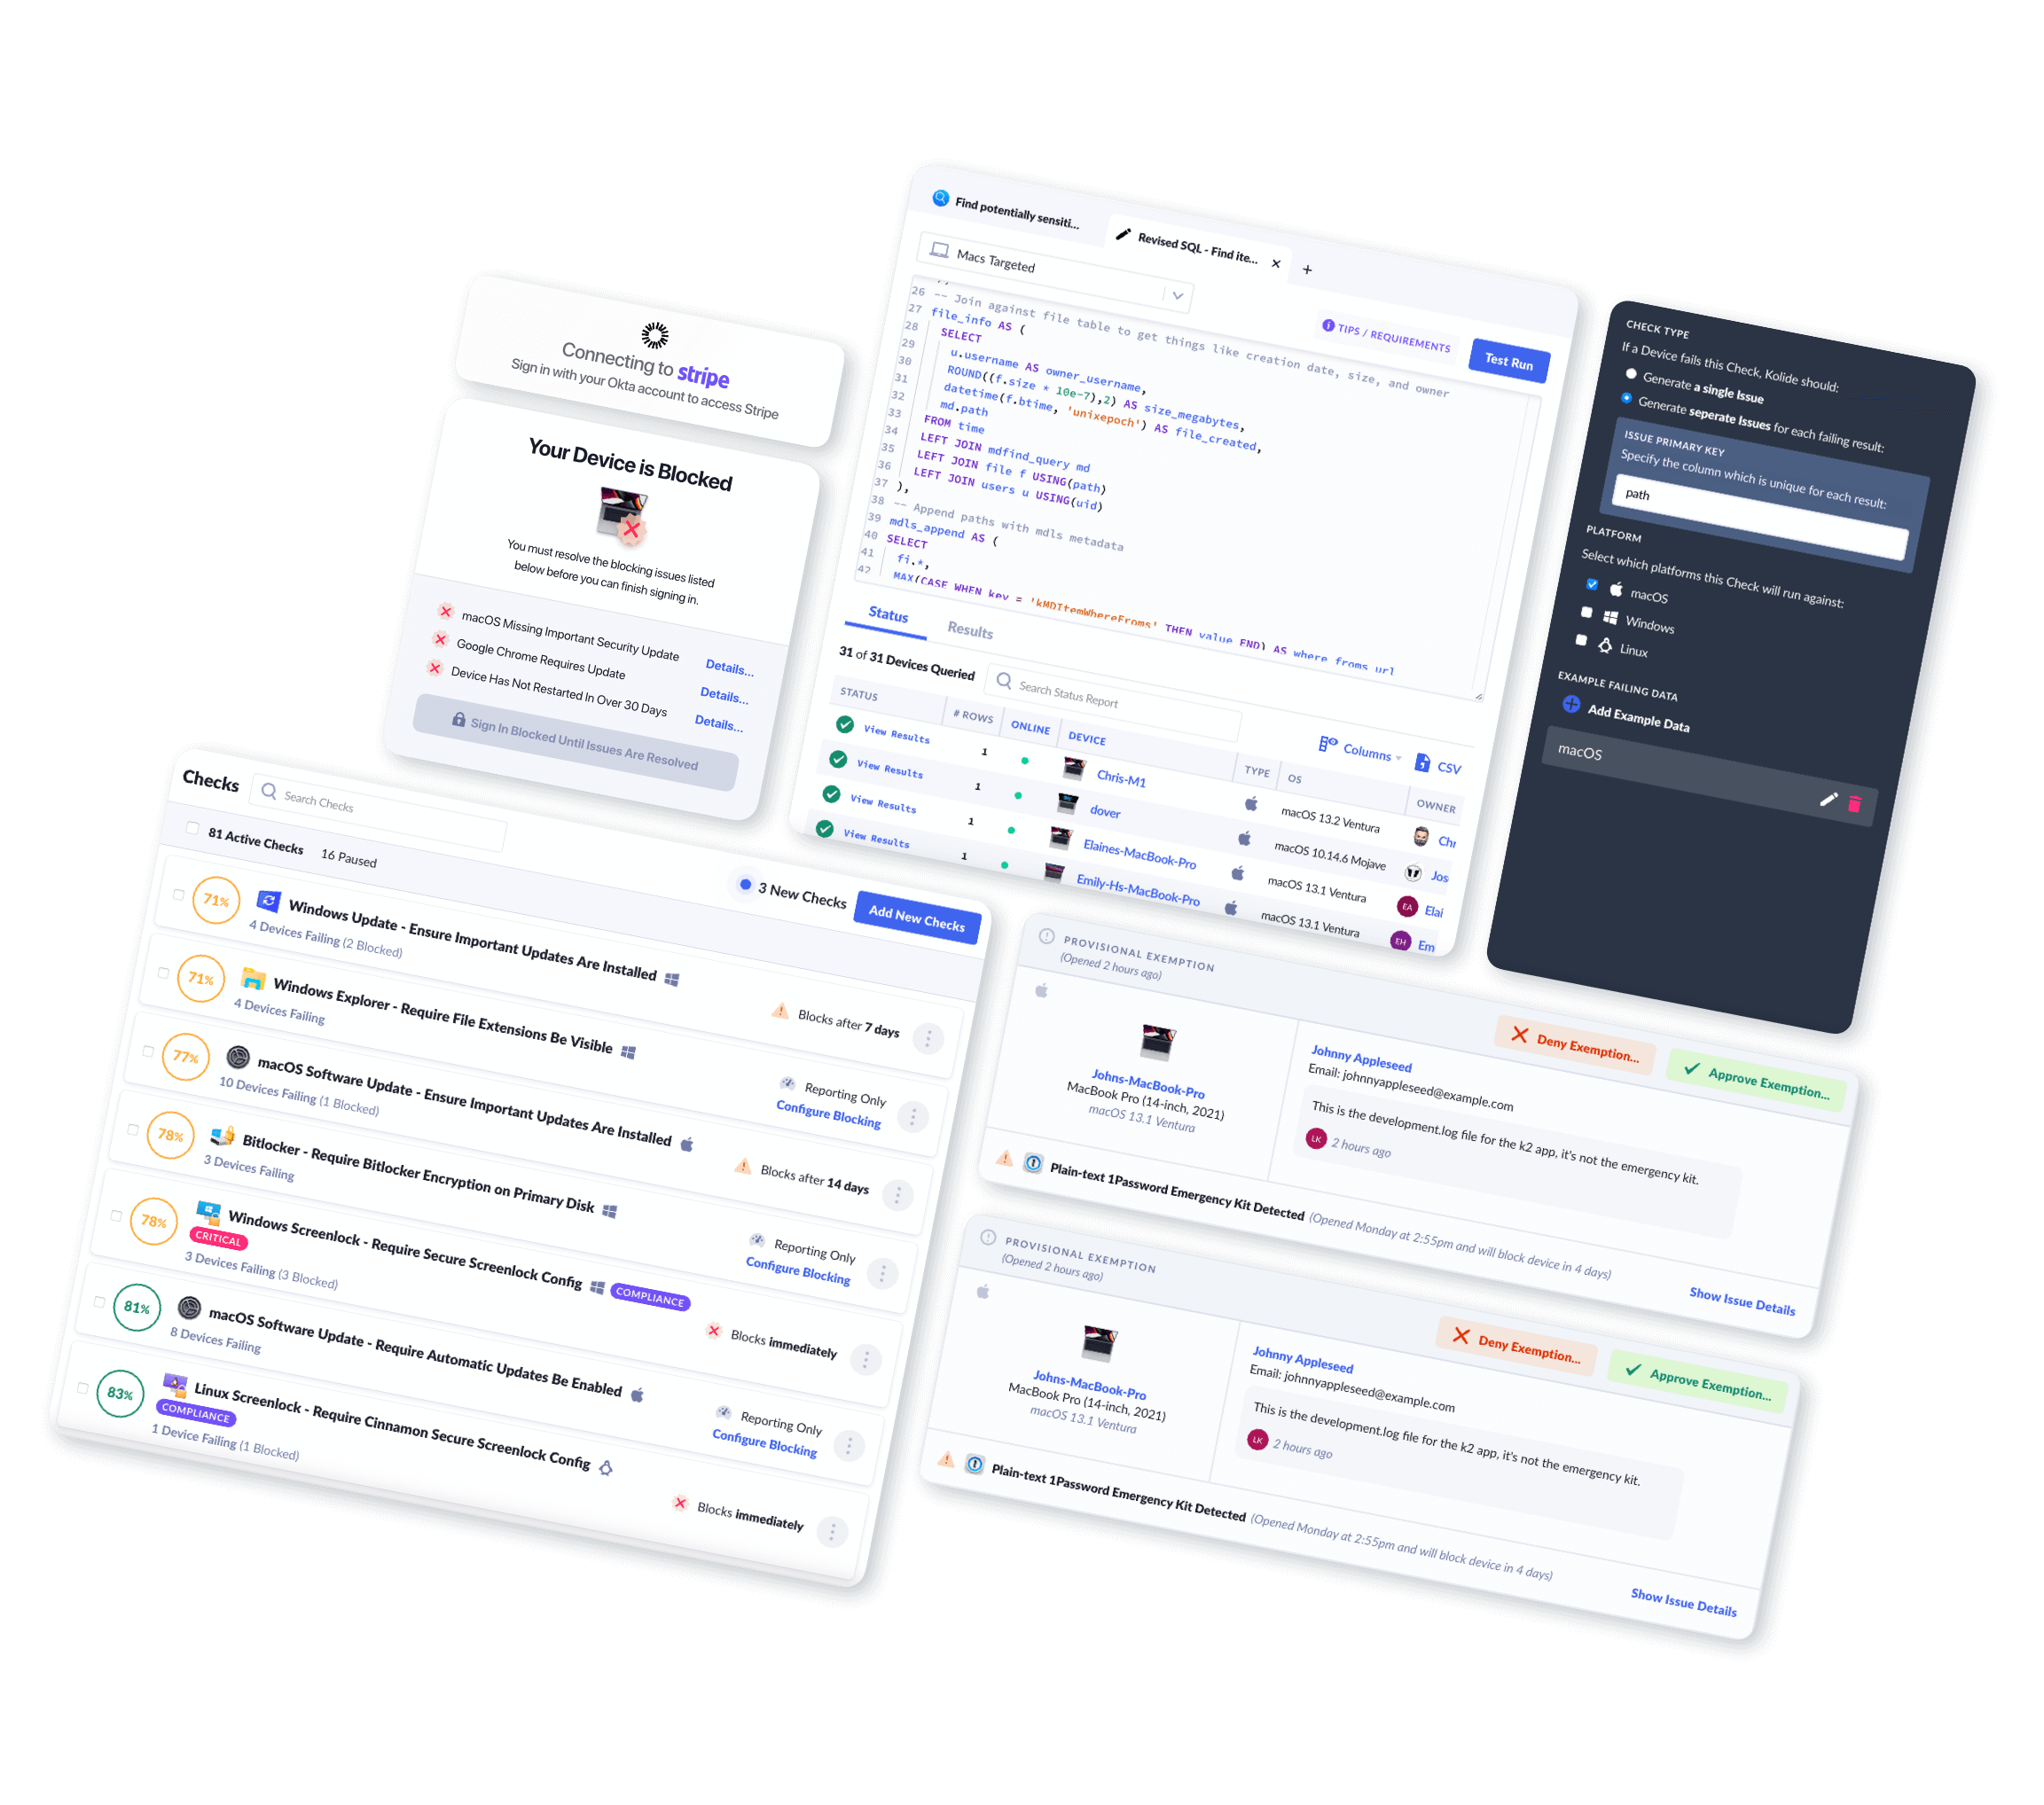
Collections at Kolide
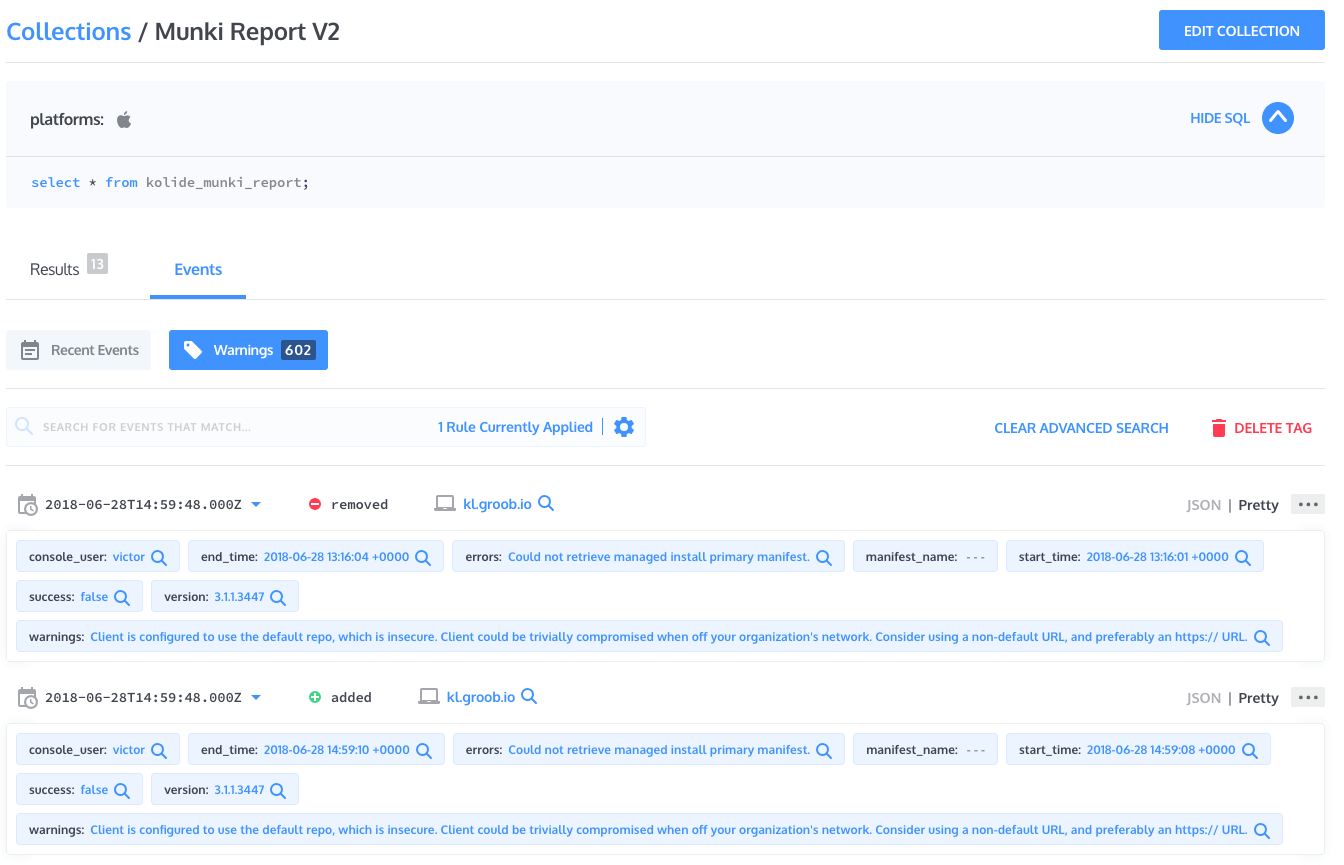
This spring, Kolide released a feature called “Collections” in our Kolide Cloud product. Collections present the user with an aggregate view of the state of their fleet across a given query, as well as the events that led to this state.
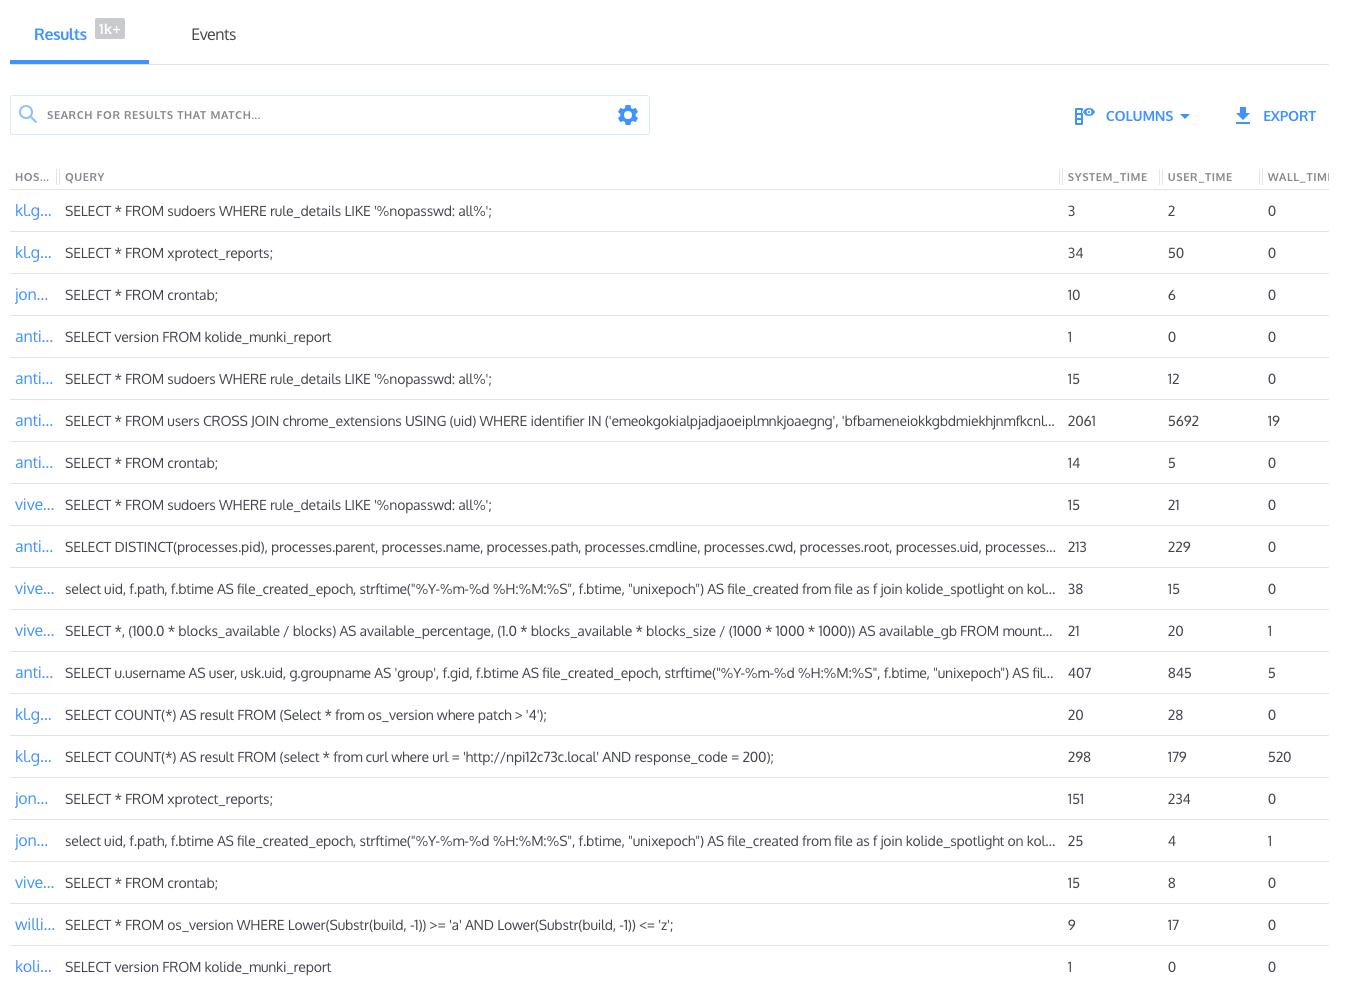
Osquery includes a table called osquery_schedule,
which keeps a record of all queries run on a machine, along with the performance
characteristics of these queries. Every instance of Kolide Cloud ships with an
osquery_schedule collection enabled, which continuously aggregates data about
query execution and performance. Typical results for this collection are below,
with a number of columns removed for clarity.
Spotting the Culprit
Looking at the results for this collection, we can make a few assumptions to narrow down the result set. To begin with, we’ll open up the advanced search dropdown (the gear near the top of the previous screenshot), and add some constraints to our search. In our case, we are interested in:
queries that have run today
queries which have run for more than 5 seconds across all executions
queries have been executed more than once
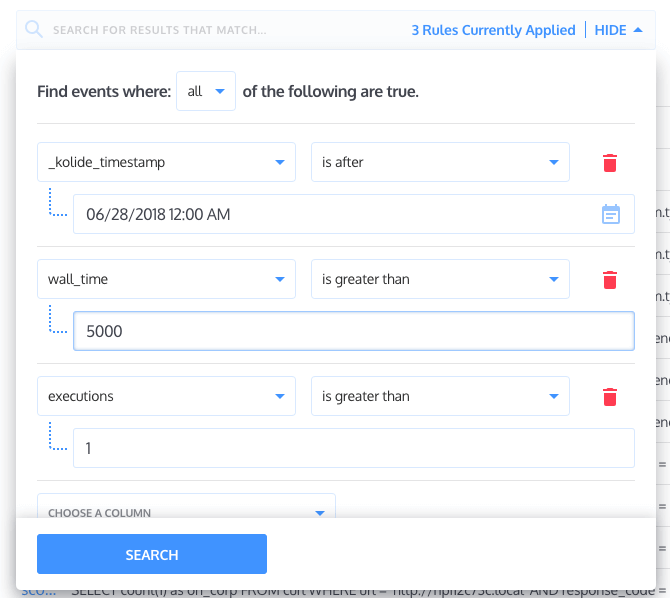
note: wall_time is the recorded unix time difference between the start
and end of a query. If a query is executed within one ‘tick’, this value
will be recorded as zero, though system_time
and user_time will still increase.
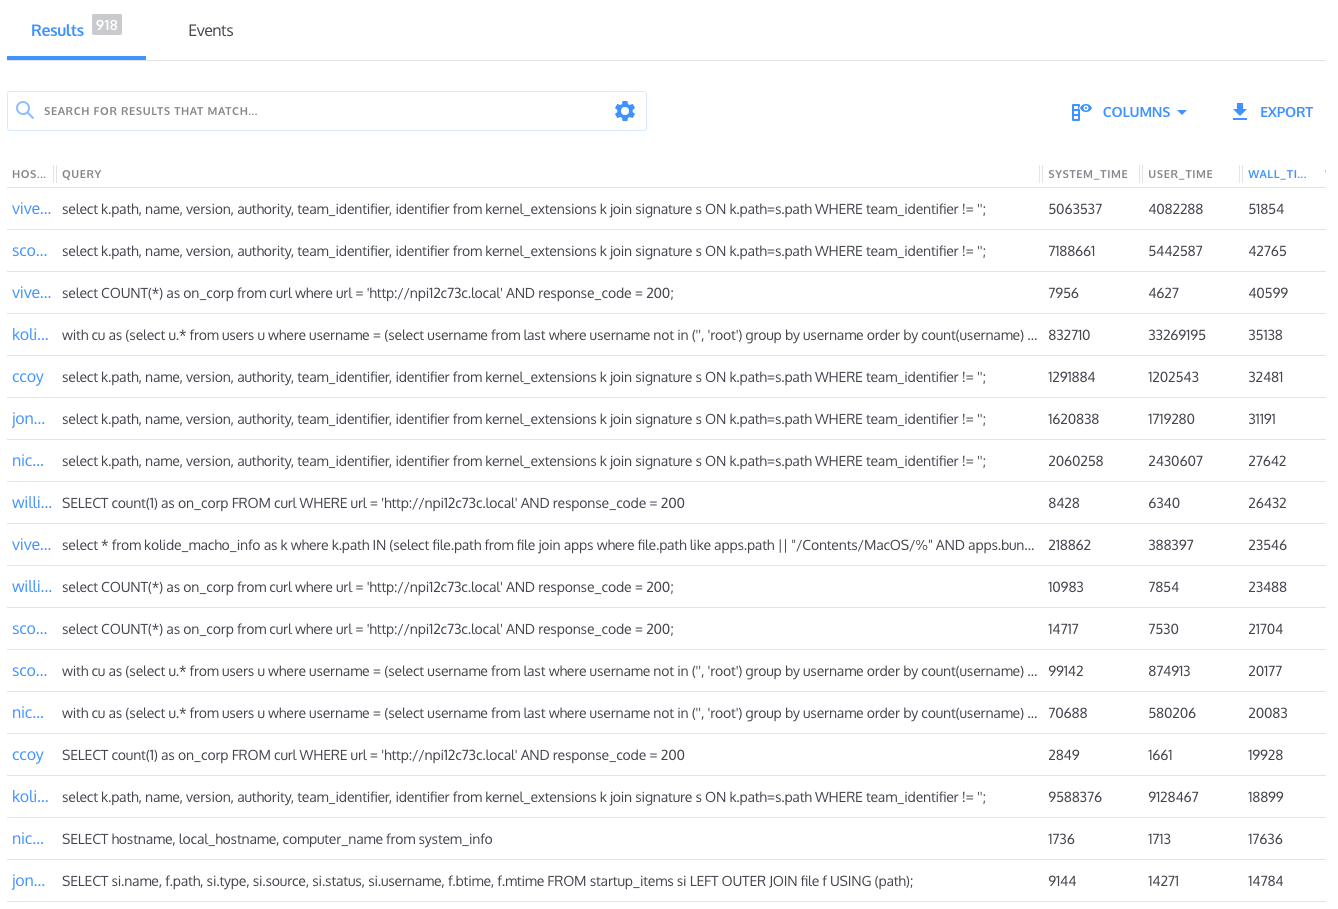
When we sort by wall time, a few repeat offenders become visible. Let’s take a look at the top one.
Setting a Good Kext-ample
Kolide Cloud ships with a collection called “macOS Kernel Extensions”, which enumerates any kexts found on a user’s machine. The query looks like this:
SELECT k.path, name, version, authority, team_identifier, identifier
FROM kernel_extensions k JOIN signature s ON k.path=s.path
WHERE team_identifier != '';
Osquery’s signature table, joined by path in this query, is very slow
(relatively speaking) because generating a signature is computationally
expensive. In the worst cases, this query would cause fans to spin up
within a second, and last for seconds at a time.
We looked at this query and realized that what we were really trying to
find was non-Apple kernel extensions, since the Apple ones are obviously
expected to be there. By adding another condition to the end of the WHERE
clause, excluding Apple’s kernel extensions by name, we thought that we might
increase performance dramatically, without affecting the intent of the query.
SELECT k.path, name, version, authority, team_identifier, identifier
FROM kernel_extensions k JOIN signature s ON k.path=s.path
WHERE team_identifier != '' AND name NOT LIKE 'com.apple_%';
Osquery has great docs on testing query performance, which let you articulate your queries as an osquery config, and benchmark the output.
Here’s our old query and the improved version in a config for testing:
{
  "schedule": {
    "macOS kexts v1": {
      "query": "SELECT k.path, name, version, authority, team_identifier, identifier FROM kernel_extensions k JOIN signature s ON k.path=s.path WHERE team_identifier != '';",
      "interval": 60
    },
    "macOS kexts v2": {
      "query": "SELECT k.path, name, version, authority, team_identifier, identifier FROM kernel_extensions k JOIN signature s ON k.path=s.path WHERE team_identifier != '' AND name NOT LIKE 'com.apple_%';",
      "interval": 60
    }
  }
}
We pipe this into the query profiler and examine the results (output trimmed for clarity).
./tools/analysis/profile.py --config ~/example.conf
 D:3 C:2 M:2 F:0 U:3 macOS kexts v1 (1/1): duration: 7.52999901772 cpu_time: 6.183422208 memory: 24412160 fds: 5 utilization: 77.06875
 D:0 C:0 M:2 F:0 U:0 macOS kexts v2 (1/1): duration: -0.489871025085 cpu_time: 0.024266762 memory: 13934592 fds: 4 utilization: 4.6
The Difference Is Clear
While there’s definitely something funky with the reported duration of our improved query (so fast we saved time running it!), the other fields make it clear that our updated query is WAY faster, while still returning results that match the intent of the original query.
We ran benchmarks multiple times on multiple machines, and found our new query consistently executing in about 1% of the time taken by the old one (or less!). Kolide is rolling out the improved version of this query to our customers this week.
A Final Note
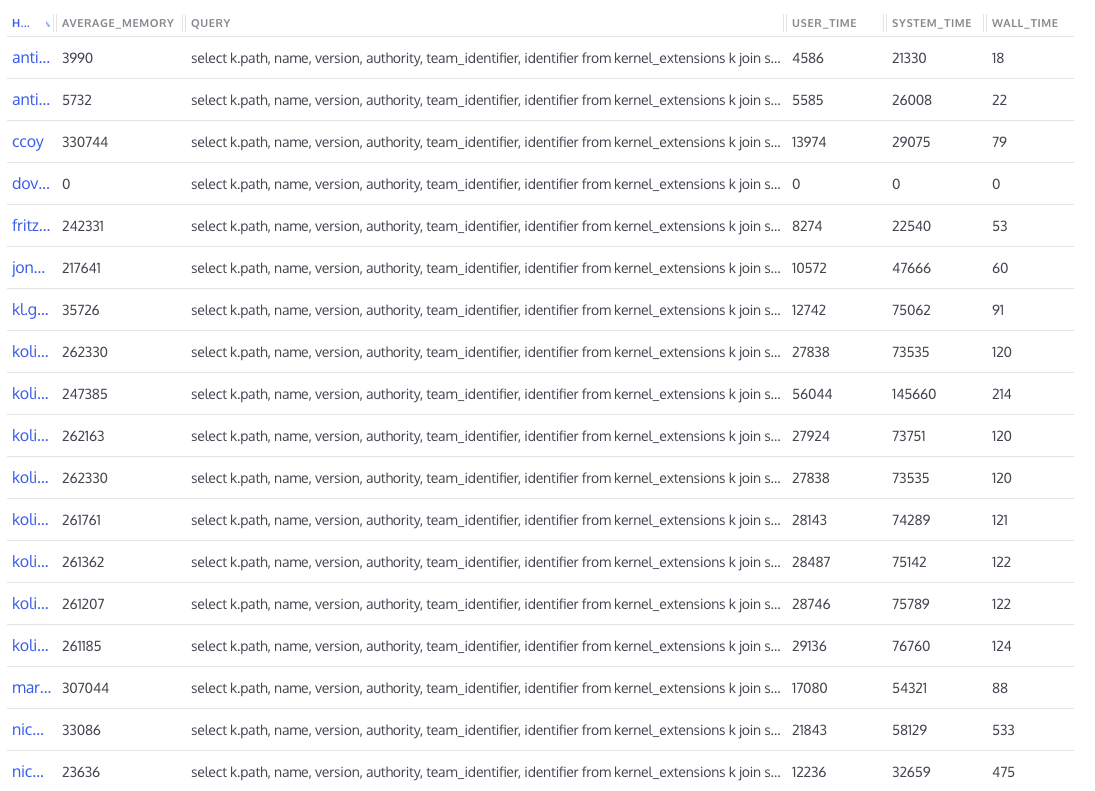
One more interesting wrinkle with profiling performance is that the same query running on every machine in your fleet might perform in a dramatically different way. In the case of this kernel extension query, an older machine might not have the horsepower to crunch signatures as quickly as a newer one would. Additionally, the state of a particular user’s computer might make their machine much slower to complete a query that targets the thing that makes them “different”. It should be no surprise that this query took significantly longer to execute on machines with many kernel extensions.
If you’d like to read more osquery content like this, sign up for our biweekly newsletter.